In 2019, the Queensland Farmers’ Federation (QFF) in partnership with Fluxpower installed Wattwatcher real-time energy meters at 50 farms participating in the Energy Savers Program. The Real Time Project was aimed to help farmers develop a better understanding of their energy use and lead to reductions in energy consumption through the implementation of energy-saving measures and practice change.
Further, QFF in partnership with Cotton Australia, Constructive Energy and ReAqua are using real-time energy monitors to determine the potential for an Energy Microgrid. The project will use the data to test the feasibility of different microgrid models where farmers may trade their energy generation and consumption in a cluster, increasing local use of renewable energy and optimise local electricity networks.
Real Time Project
The Real Time Project connected a Wattwatcher smart meter on participating farm and measured energy consumption in real-time, monitoring from two to six circuits per meter, depending on the number of phases of the circuits. With most farms using a three-phase power supply, the device was limited to monitoring two circuits. Ideally, these were main load and solar although different installations are being monitored, depending on the main energy load or interest of the farm, such as pumps, lighting, power, or heating, etc.
Energy data was captured every five minutes, stored in the cloud, then displayed on Fluxpower or Wattwatchers’ real-time dashboardwhich could be accessed from the landholders’ desktop or mobile device.
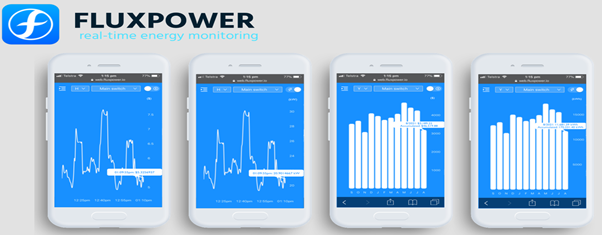
Fluxpower Dashboard
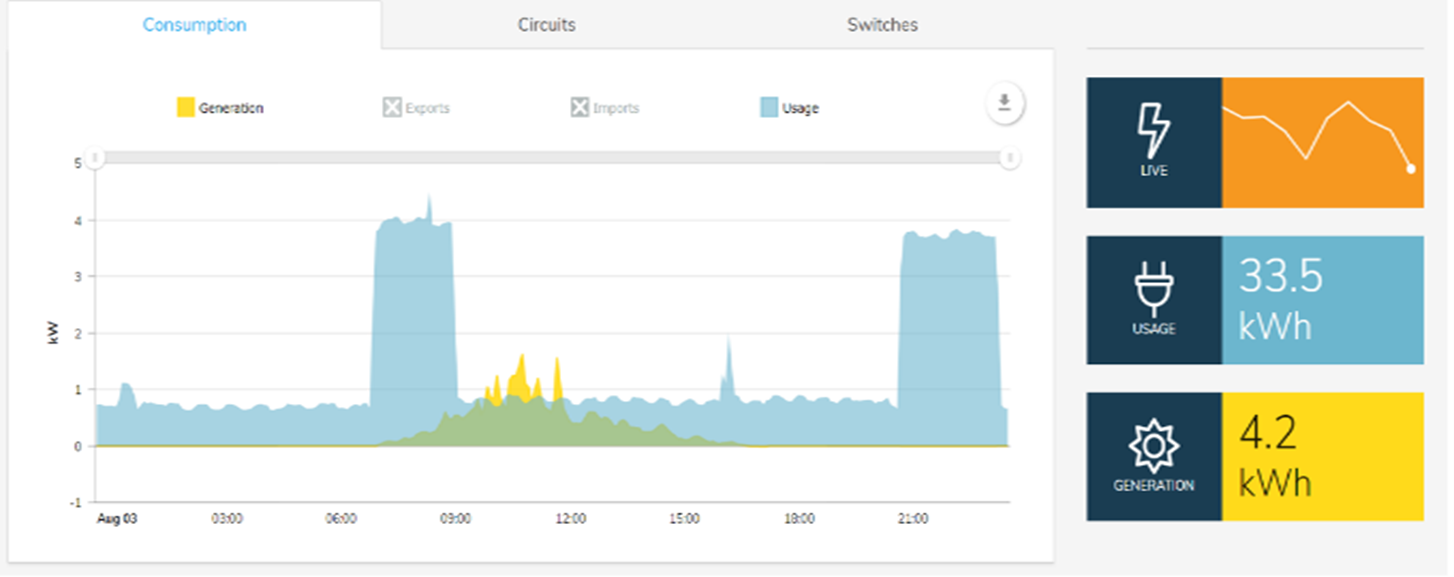
Wattwatcher Dashboard
Both dashboards display live weekly, monthly, or yearly data on energy consumption, or generation (if a solar system has been connected), with only Fluxpower’s showing the associated costs according to the current operating tariff selected at the meter when installed.
The Wattwatcher dashboard allows overlays of consumption and generation, imports and exports. In both dashboards, it is possible to hover over a point in time to view current and accumulated demand for a particular period (minutes, hours, days, weeks, months, or years).
Energy data can be downloaded and displayed in an excel spreadsheet for a specific time. This below example shows a five-minute interval data (time between rows) over a period of 35 minutes (all rows).

This information can be used to better understand energy use patterns, identify energy-saving opportunities, guide tariff choices, and allow tools or metrics to be developed to change management practices or decisions through manual or automated control. This promotes decreases in demand, costs, and improvements in energy efficiency.
Farmers’ interactions with the real-time energy data, their perceptions regarding energy efficiency, barriers to adoption and views on potential opportunities this have been gathered through in-depth interviews, with interesting results.
To optimise the use of the real-time energy monitoring device on your property, consider purchasing a small tablet designated for energy monitoring that can be displayed in the office or staff area and follow some of the points below:
- Make a habit of logging in, viewing and reviewing data regularly to understand the patterns of consumption and generation in your farm. To view logins for Fluxpower head HERE and Wattwatcher HERE.
- View and download the data set required for the period needed – this could be set as a growing period for the crop, harvest, or production.
- Analyse and interpret the data displaying it visually as Energy Use Breakdown (picture).

- Establish energy benchmarks to measure your farm energy performance, such as kWh/ML/m head, kWh/m2or kWh/unit of production.
- Apply practice change aimed at improving energy efficiency, like turning off devices when not in use, or shifting pumping or milking times during excess solar generation, if possible, as seen in this case study HERE.
- Revisit your benchmarks to see if improvements in efficiency have taken place.
Complementary Technologies
Other technology providers that focus on the monitoring of energy and its efficient use for automation include:
- eGauge: provides mobile alerts when discrepancies are seen whilst energy is being monitored. Can assist in tracking your return on investment and show potential energy savings from implementation of efficient upgrades leading to real dollar savings. Data can be downloaded and viewed across an excel spreadsheet.
- Solar analytics: monitors solar systems in real-time to help match major energy consumption with greater solar generation. Also provides an analysis of the daily performance of the system based on weather patterns. The app sends mobile alerts when failures or under-performance are detected.
- Reposit: shows the solar generation, energy consumed and exported to the grid and battery charge. Allows switchable devices, which leads to automation and ease of use. For example, pumps can be turned on remotely at a time that suits, possibly during solar generation. Reposit also allows users to top up the battery charge when grid market prices are cheap. Battery owners could participate in the Virtual Power Plant (VPP) network to sell the power stored.
- Redback Technologies: meters monitor electrical loads, including solar, in real-time. Redback smart meters are typically used for residential purposes including home battery and solar energy management products and services. The MYRedback app and portal provide real-time interfacing and insights into consumption, generation, and performance.
- CarbonTRACK: this energy management system combines smart metering, IoT integration, and behind the meter demand management functionality on a dashboard and app to analyse and control connected circuits remotely and in real-time. CarbonTRACK’s products and services have been used by electricity utilities, retailers, VPP operators, and residential to industrial consumers.
Aside from energy, there are a wide range of sensors that capture real-time information across a range of variables, such as weather, water, energy and plant growth. The data provides the information needed to aid in the decision-making process on-farm. Based on this additional information, it is possible to identify where automation of equipment can lead to optimisation of on-farm operations, such as irrigation pumps and solar PV generation. This allows you to save energy, water, time, and money. Automation technologies can include manual remote switching controls for appliances switched from the use of a mobile device or desktop computer, or timers that can be pre-programed as set by the information captured. Read more about this in the connectivity and efficiency article HERE.
You cannot manage what you don’t measure.
Real-time metering with regular energy monitoring will help manage and improve your energy efficiency.
If you have a question about the technology and how it can help on farm, contact us at energysavers@qff.org.au