A 160-hectare Darling Downs dairy farm producing milk, milk solids, and some grain milling is a large energy user consuming 145,000 kWh/year.
The farmer has implemented the solar PV and chilled water systems recommended.
A 160-hectare Darling Downs dairy farm producing milk, milk solids, and some grain milling is a large energy user consuming 145,000 kWh/year.
The farmer has implemented the solar PV and chilled water systems recommended.
This case study looks at ways to decrease energy use below 100,000kWh per annum to reduce demand charges using recommendations in the audit. The audit showed additional opportunities with energy management using pressure and temperature monitoring, and low-cost maintenance of general equipment onsite.
General recommendations in the audit included;
The main contributor to energy usage onsite is milk cooling. Cooling milk requires using the initial water plate cooler, a secondary glycerol plate cooler, and storage in a large cooled milk vat. The general standard for milking is to cool the milk down below 5°C within less than 3.5 hours of milk extraction.
| Cooling Element | Energy Use (kWh) | Site Energy Use (%) |
| Plate Cooler 1 | 3,900 | 3 |
| Glycerol Plate Cooler | 15,000 | 10 |
| Milk Vat | 17,400 | 12 |
| Cooling Tower | 1,800 | 1 |
| Total | 38,100 | 26 |
The preliminary analysis identified potential energy savings for the cooling system, including:
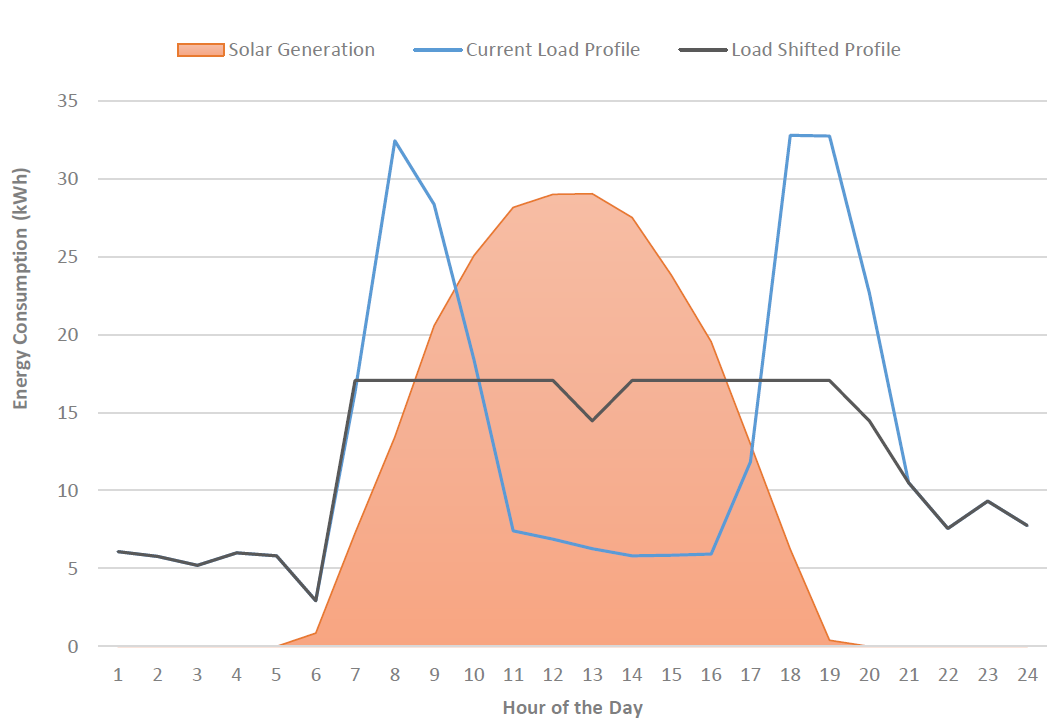
Generally, milking occurs outside peak solar generation periods. The audit recommended shifting the load across the middle of the day, achieving a best-case scenario, increasing the solar utilisation by 29%. This could be achieved using a new chilled water system that utilises the existing glycol refrigeration loop to chill water stored in an insulated tank. This chilled water would be used to cool the milk vat and pre-cool milk via the secondary plate cooler (replacing the glycol circulation in this plate cooler). This operation is a form of thermal storage and would need to occur in the hours between milking to maximise the energy offset from the solar system.

Figure: Current and proposed solar utilisation from practice change.
The energy, cost savings, and payback period for works on the cooling system are summarised below.
Table 1. Energy and cost savings from audit recommendations.
| Recommendation | Energy Savings (kWh) | Cost Savings ($) | Payback Period (years) | Capital Cost ($) |
| Solar PV and chilled water installation | 50,271 | 12,678 | 7.9 | 99,750 |
| Shade/insulate outdoor storage tanks | 2,322 | 359 | 7.6 | 2,727 |
| Permanent data logging of key areas | 1,500 | 1,232 | 1.2 | 1,500 |
| Management opportunities | 1,000 | 404 | 3.5 | 1,400 |
| Total | 55,093 | 14,673 | 5.05 | 105,377 |
Implementing the project and shifting an annual pump using 30,000kWh off the dairy NIMI would bring consumption below the 100,000kWh threshold. This would allow the adoption of a small user tariff 20 providing a payback of 7.9 years.
The grower has proceeded with the implementation of the 30kW solar PV and chilled water systems. The savings have been measured in a Measurement and Verification (M&V) process as outlined in Table 2.
Table 2. Estimated and Actual energy and cost savings.
| Metric | Audit estimation | M&V calculation | Variation (%) |
| Energy Savings including exports (kWh) | 50,271 | 59,474 | 18 |
| Cost Savings including exports revenue ($) | 12,678 | 13,019 | 3 |
The savings measured are in line with the estimated in the audit.
During the measurement period, the farm’s energy consumption was 20% lower than the audit period, which is likely due to a change in climatic conditions, since most of the energy is used for cooling. This together with the solar offset, has allowed keeping the farm’s energy consumption below 100,000 kWh per year.
From the annual solar generation, 39,795 kWh or 67% are being used onsite valued at $11,724, and around 19,679 kWh are being exported to the grid with a revenue of $1,295. Considering that 76,803 kWh – 66% of the total energy used onsite – are being imported from the grid at a cost of $22,626, there are still potential savings from shifting consumption into the solar generation period, if possible.
By implementing the solar PV and chilled water systems, the farm has reduced energy consumption by 40% and costs by 30% based on pre-audit values, with carbon emission savings of 48.2 tCO2-e per year. The national average energy use on dairy farms in Australia is 48 kWh/kL of milk, by implementing the cooling recommendations, the site has reduced the current kWh/kL of milk by 40%, bringing this below the national average.
Table 3. Pre and post implementation energy, costs, and productivity savings.
| Metric | Pre-Implementation | Post-Implementation | Reduction (%) |
| Energy consumption (kWh) | 145,600 | 86,126 | 40 |
| Energy costs ($) | 42,894 | 29,875 | 30 |
| Productivity (kWh/kL of milk) | 55 | 33 | 40 |
An energy audit is a good investment
An energy audit is a great way for a business to cut costs and boost productivity.
An energy auditor will review your past energy bills, your equipment and the way your business operates. They’ll show you where you’re using excess energy and explain what you can do about it.
Find out about what’s involved in an energy audit HERE and subscribe to our bi-monthly energy e-news HERE.
If you have any energy efficiency-related questions for the team, get in touch at energysavers@qff.org.au.
The Energy Savers Plus Extension Program is delivered by the Queensland Farmers Federation with support and funding from the Queensland Department of Energy and Public Works.

