The site farrows and weans pigs before transporting them to a larger site for finishing. The site has several sheds for different rearing stages, two houses, a small office, and two pumps.
The farm could save electricity onsite from recommendations in the audit:
- Upgrade lighting using new LEDs, which is the quickest way to improve efficiency onsite with a payback period of less than a year.
- Upgrade Ventilation fans.
- Reflective roof coating.
- Solar Bore pump with or without battery storage.
- Various solar PV systems up to 100kW in size.
Table 1. Costs and savings from audit recommendations with quick payback.
| Recommendation |
Energy Saving (kWh) |
Cost Saving Tariff 62 ($) |
Cost Saving Tariff 20 ($) |
Payback Period Tariff 62 (Years) |
Payback Period Tariff 20 (Years) |
| Upgrade lighting to new LEDs |
26,280 |
10,990 |
8,300 |
0.5 |
0.9 |
| Fan Upgrades |
14,400 |
4,200 |
3,700 |
9.5 |
10.8 |
| Reflective roof coating |
7,500 |
3,000 |
1,800 |
>20 |
>20 |
| Total |
48,180 |
18,190 |
13,800 |
N/A |
N/A |
Under current tariff 62, the annual cost savings of $10,990 from replacing the lights could be utilised to install an adequate solar PV system.
The audit also considered several solar energy opportunities with relatively quick paybacks, including:
- Two smaller residential solar systems 1.5kW and 5kW.
- Bore Pump: Solar only or Solar and batteries.
- Large scale solar PV systems of 30kW or 99.5kW.
Table 2. Costs and savings from audit recommendations with longer payback.
| Recommendation |
Energy Savings (kWh) |
Cost Savings Tariff 62 ($) |
Cost Savings Tariff 20 ($) |
Payback Tariff 62 (Years) |
Payback Period Tarif 20 (Years) |
| Two Residential Solar Systems |
7,930 |
3,700 |
2,300 |
2.4 |
3.8 |
| Bore Pump: Solar only (Tariff 33) |
10,900 |
1,600 |
N/A |
4 |
N/A |
| Bore Pump: Solar and batteries (Tariff 33) |
13,000 |
1,900 |
N/A |
11 |
N/A |
| 30kW Solar PV |
43,000 |
14,500 |
9,000 |
2.9 |
4.3 |
| 99.5kW Solar PV |
62,000 |
19,600 |
11,400 |
4.9 |
9.4 |
Assuming the bore pump is on load control tariff 33, an initial solar system is recommended to cover the load, showing a four-year payback. Should battery pricing decrease, then the second option may be worth considering. It would be worthwhile to factor this when designing a system using a battery-capable invertor.
Solar systems greater than 30kW are subject to a more complex network connection process, so installing the 30kW system would prove beneficial at this stage. The audit recommended remaining on tariff 62 as the system shows better payback. The farm will be required to move to Tariff 20 when the obsolete tariffs cease.
Table 3. Costs and savings from preferred audit recommendations.
| Location |
Current Usage (kWh) |
Current Cost ($) |
Recommendation |
Energy Saving (kWh) |
Cost Savings ($) |
Capital Cost ($) |
| Piggery |
115,272 |
36,607 |
Lighting and
30kW Solar PV |
26,280
43,000 |
5,500
14,500 |
5,000
13,000 |
| Main Bore Pump |
10,385 |
2,001 |
Solar system only |
10,900 |
1,600 |
10,000 |
| Farmhouse |
15,435 |
5,408 |
Solar PV |
7,900 |
3,700 |
8,100 |
| Total |
141,091 |
44,016 |
N/A |
88,080 |
25,300 |
36,100 |
Implementation of the recommendations at the piggery will ensure that the farm is able to remain a small electricity user on small business tariffs.
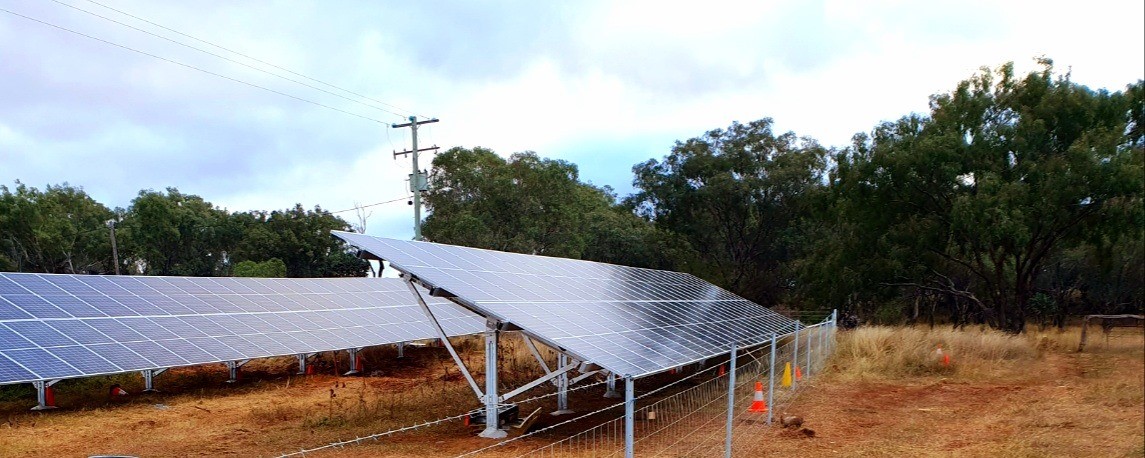
The farmer has proceeded with the installation of a 39.36 kW ground-mounted solar system with 2 x 15 kW inverters (pictured above). The energy and cost savings made have been measured in a Measurement and Verification (M&V) process, as outlined in Table 4.
Table 4. Estimated and Actual energy and cost savings.
| Metric |
Audit estimation |
M&V calculation |
Variation (%) |
| Energy Savings (kWh) |
43,000 |
76,282 |
77 |
| Cost Savings ($) |
9,000 |
14,692 |
63 |
The greater savings obtained from the M&V calculations compared to those estimated in the audit may have been influenced by the larger system implemented. No additional factors have been identified, such as higher solar radiation during the measurement period or optimisation of the orientation of the panels.
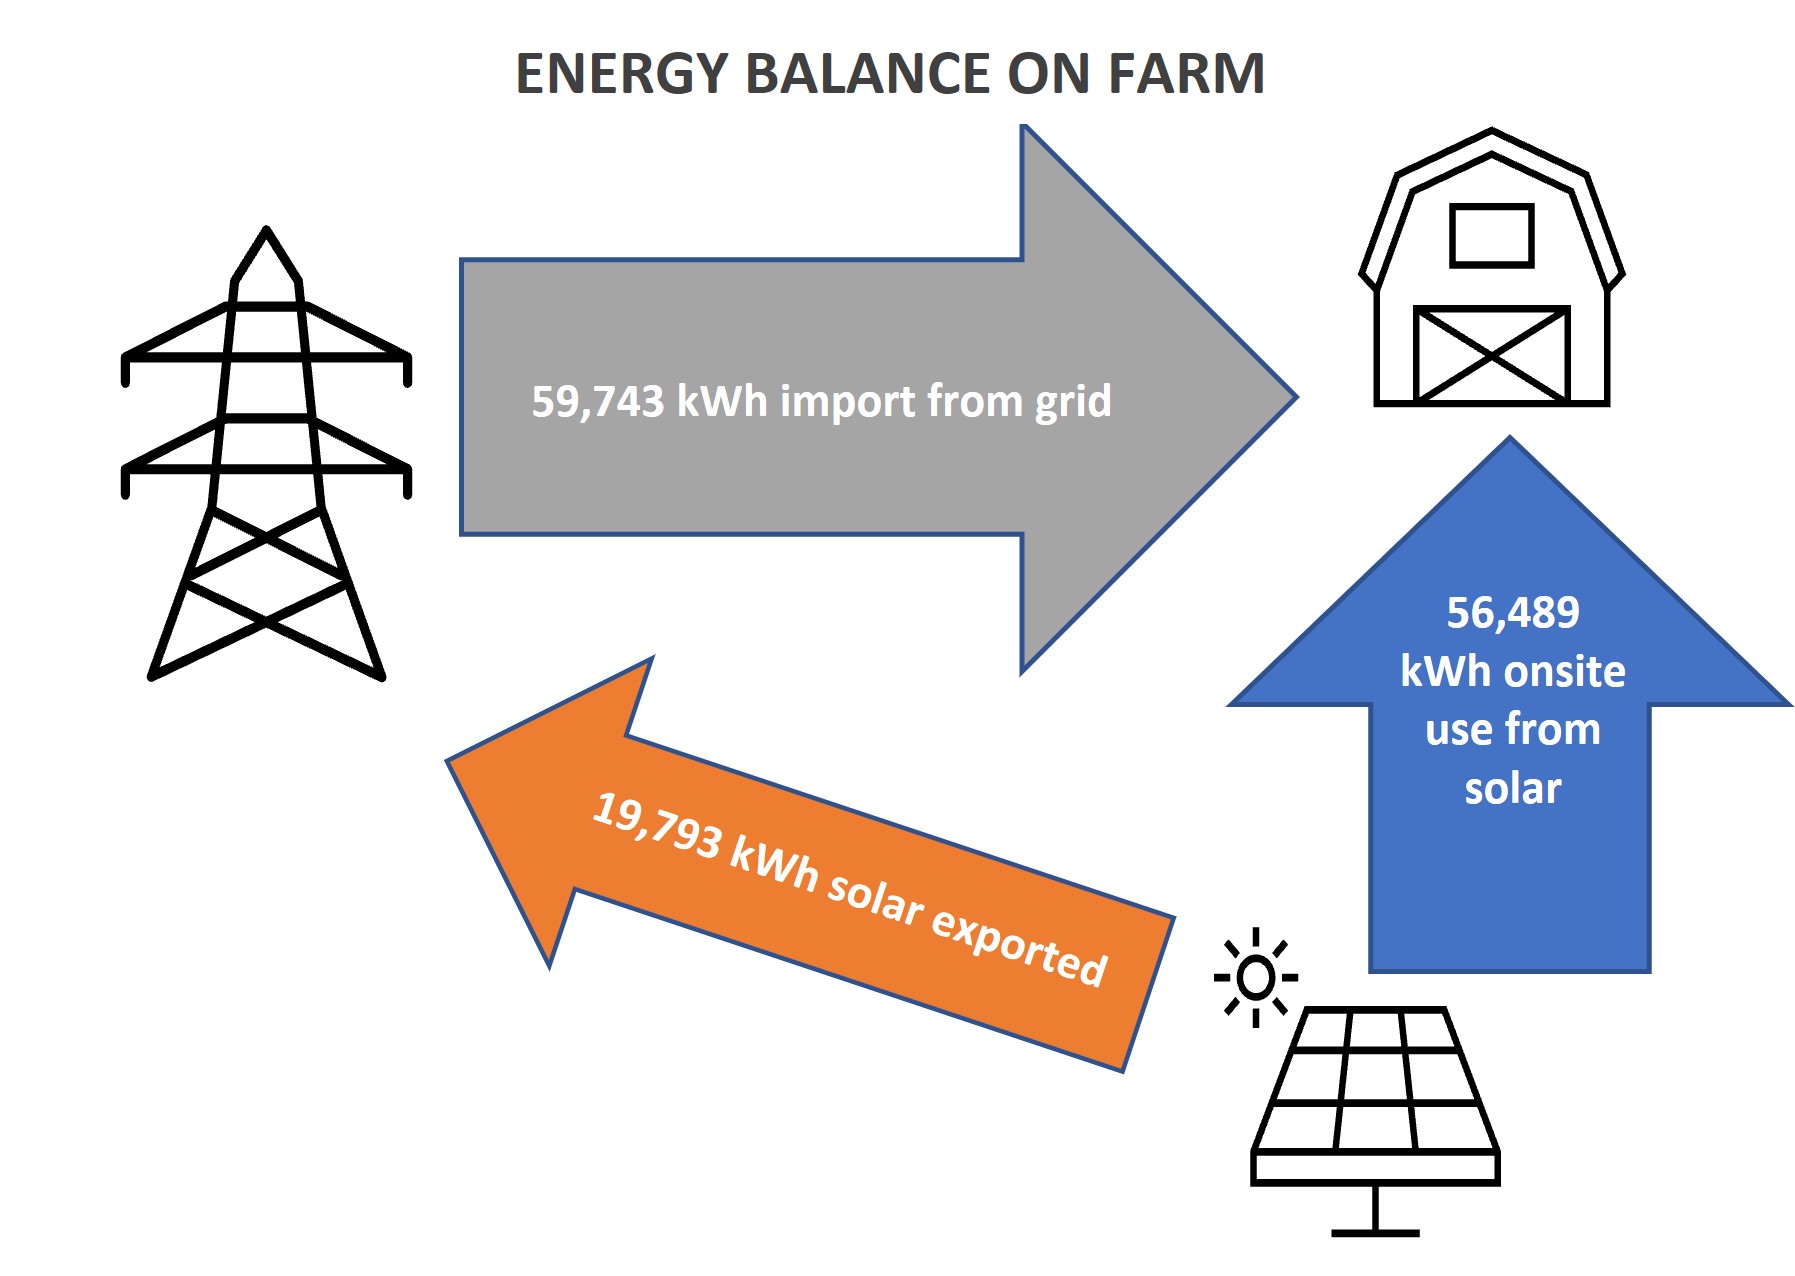
From the solar generation, 74% or 56,489 kWh are being used onsite valued at $13,136, and 19,793 kWh are being exported to the grid with a revenue of $1,556. Considering that 59,743 kWh – 51% of the total energy use onsite – are being imported from the grid at a cost of $13,893, there are significant potential savings from shifting consumption into the solar generation period. The total power balance of the farm, including solar exports and the energy cost distribution, are shown in the following figures.
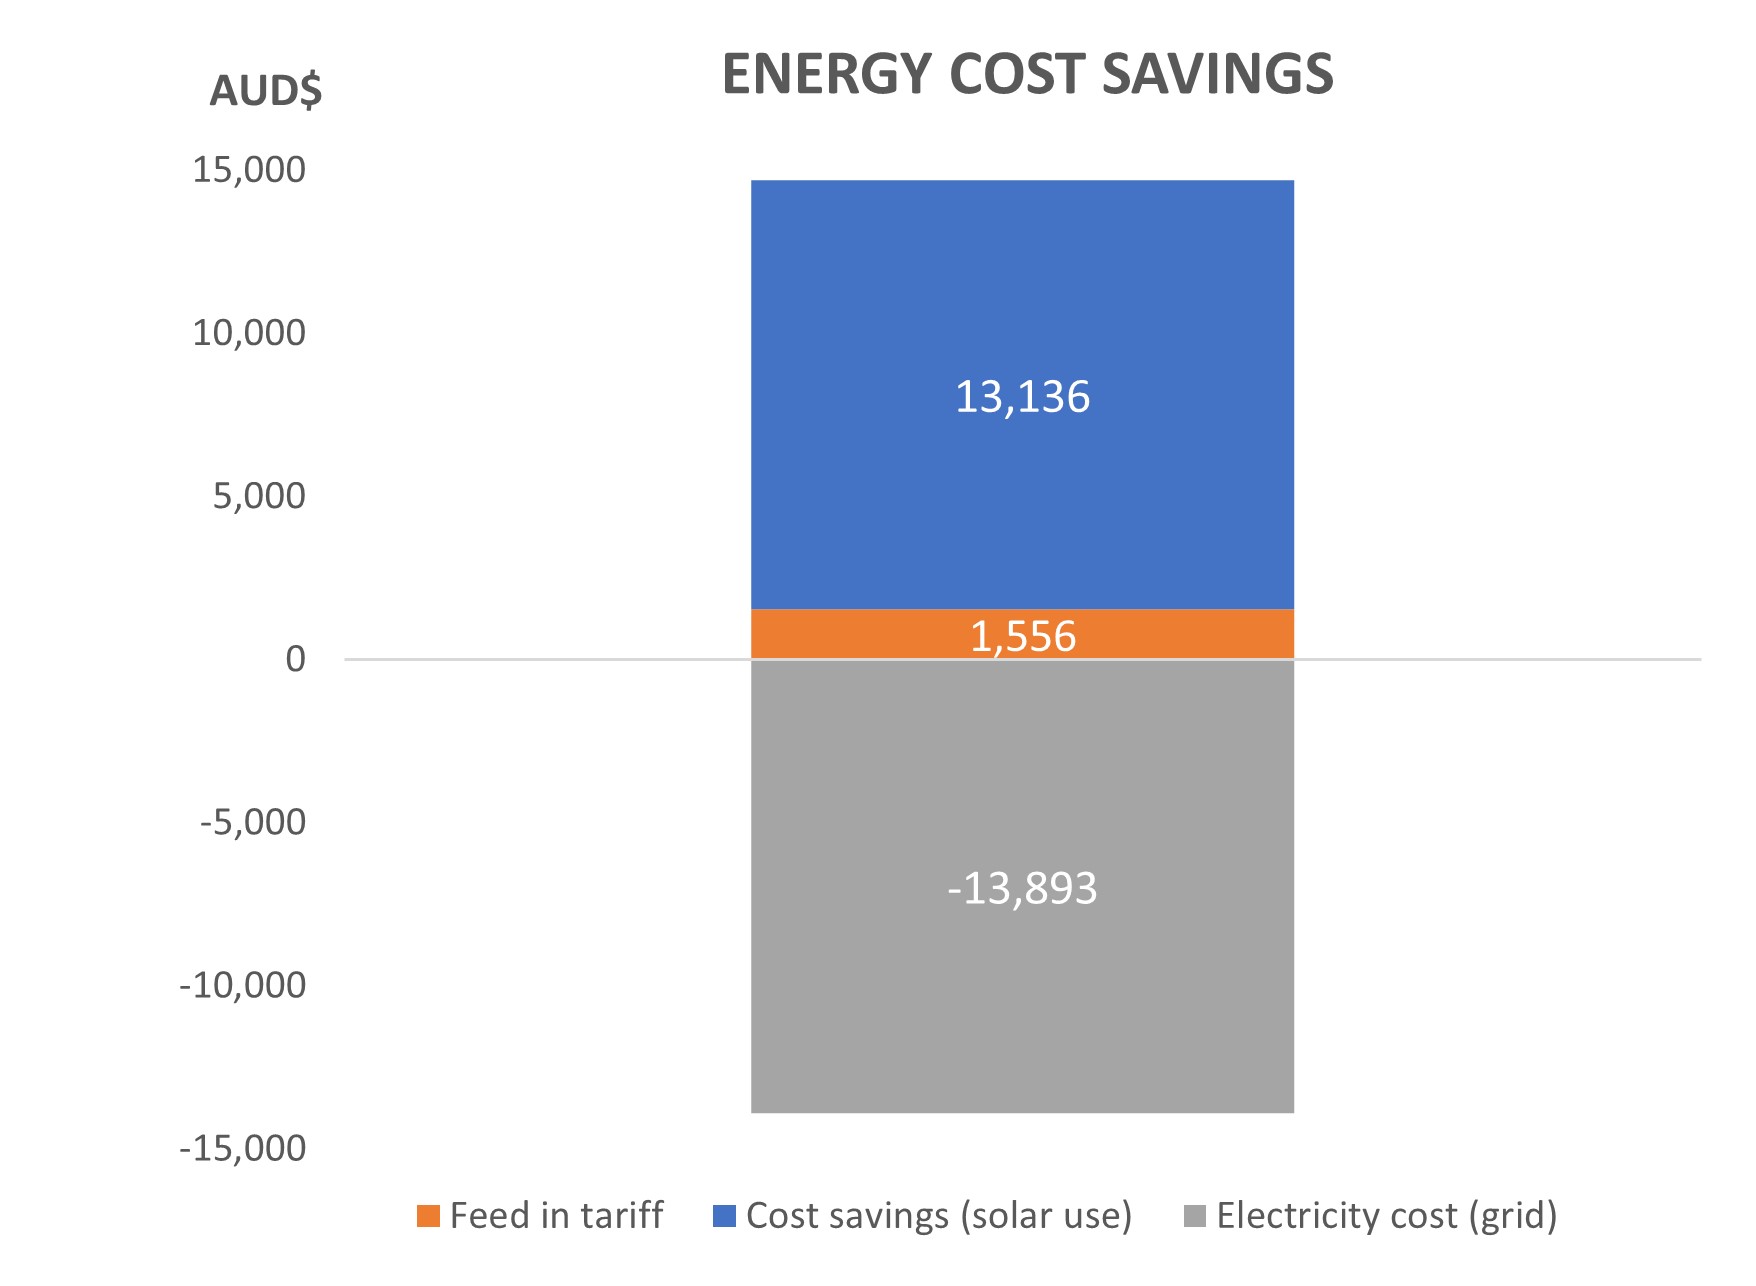
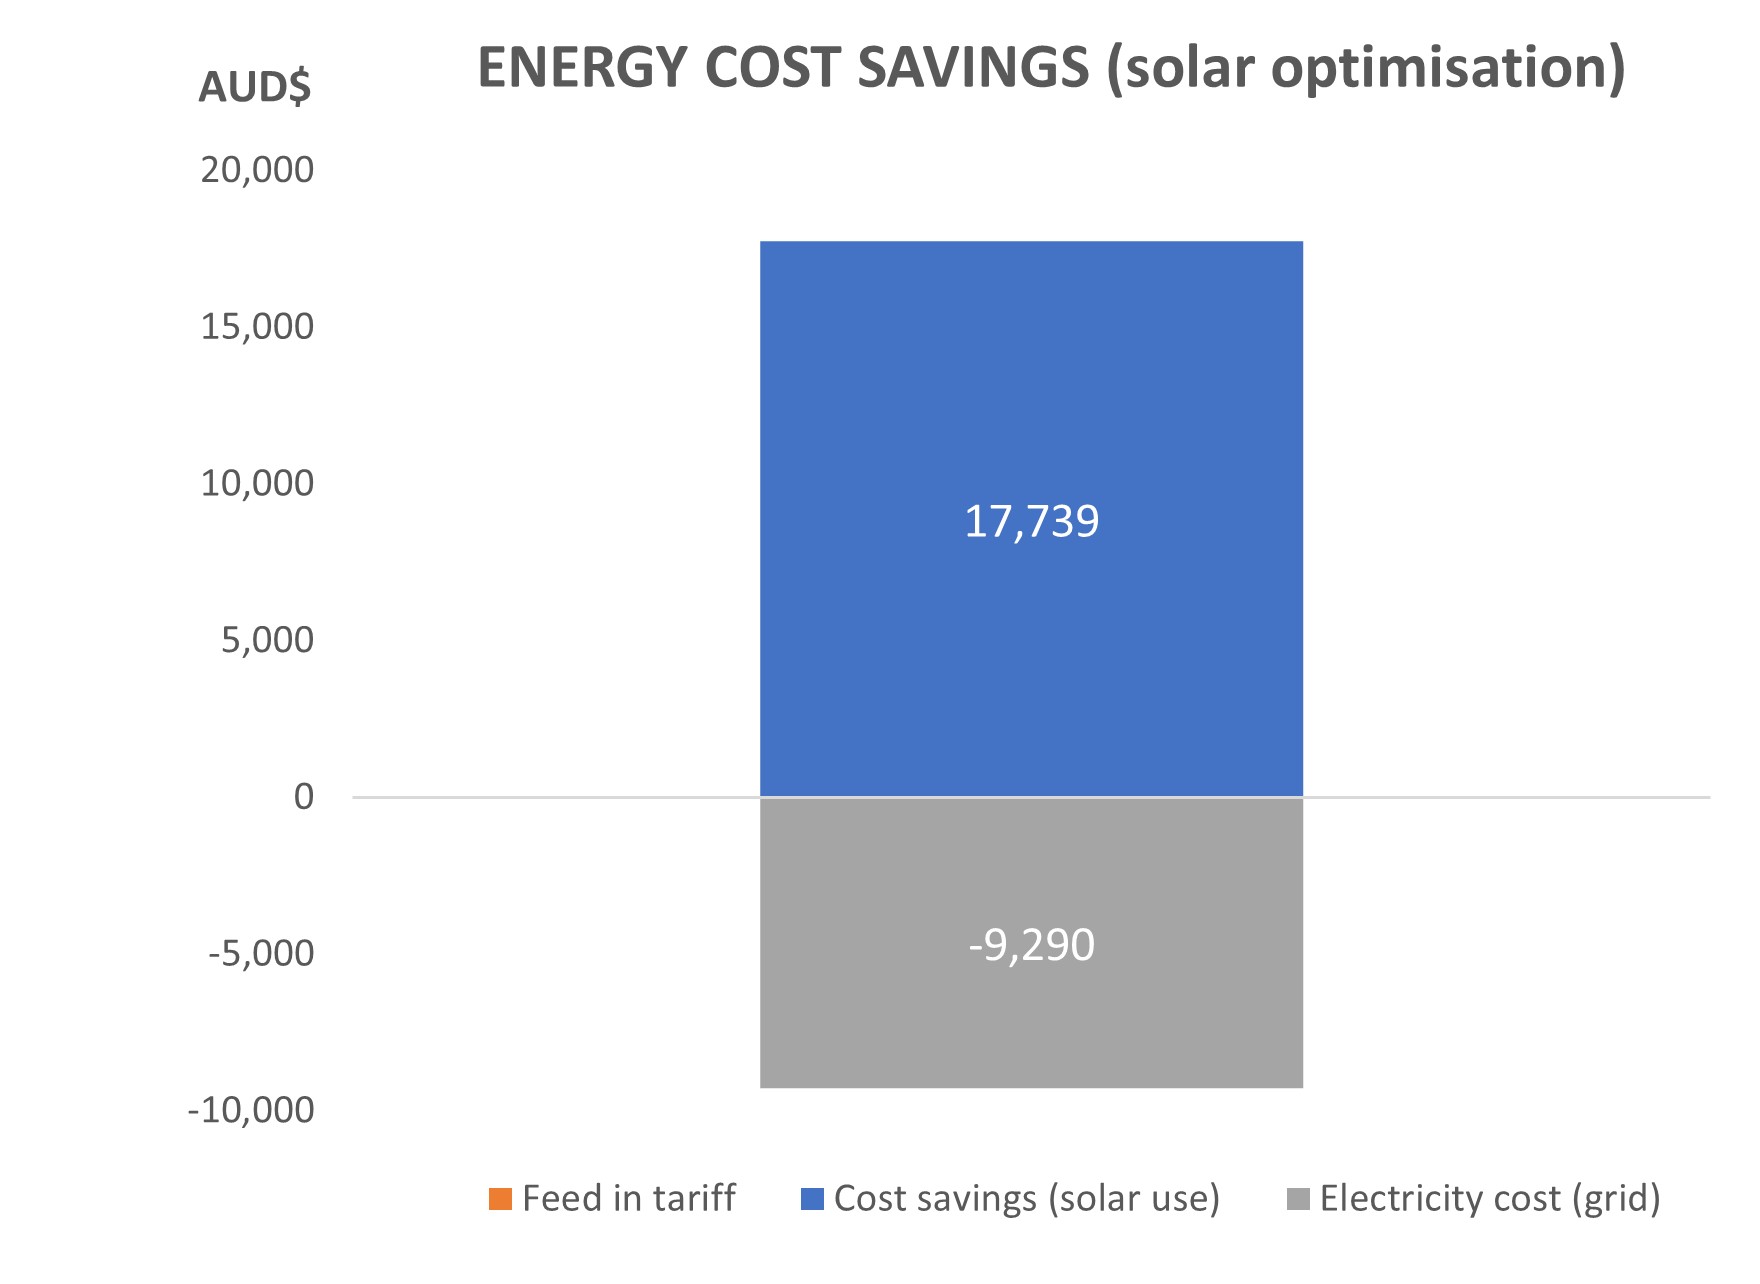
The next step for the farm is to adjust energy usage to offset as much energy consumption as possible from the grid, which would lead to further cost savings. The revenue from feeding into the grid is lower than the cost savings from using the energy onsite: for every dollar of energy exported, more than $3 could be saved if the energy were consumed onsite. If the farm were to shift 19,793kWh of energy consumption per year to coincide with solar generation times, they would save an extra $3,047 per year.
From the implementation of the recommendation in the audit, the farm has reduced total energy consumption by 54% and cost savings by 33%, including feed-in revenue, with Carbon emission savings of 61.8 t/CO2-e per year.
Table 5. Pre and post implementation energy consumption, costs and energy productivity improvements.
| Metric |
Pre-implementation |
Post-implementation |
Reduction (%) |
| Energy Consumption (kWh) |
141,091 |
64,809 |
54 |
| Cost ($) |
44,016 |
29,324 |
33 |
| Energy Productivity (kWh/pig) |
6.56 |
3.0 |
54 |